
The financial well-being of American families is a topic of significant interest, and within this landscape, farm households present a unique perspective. While discussions about Average American Family Income often focus on urban and suburban populations, it’s crucial to understand the economic realities of those who contribute to the nation’s agricultural sector. This article delves into the income of U.S. farm households, drawing on data from the U.S. Department of Agriculture, Economic Research Service (ERS), to provide a comprehensive picture of their financial status in 2023.
Recent data indicates a shift in the financial landscape for farm households. In 2023, the estimated median total income for these households experienced a decrease compared to 2022. This decline was observed not only in total income but also in median farm income and median off-farm income. Specifically, at the median, income derived directly from farming activities was -$900 in 2023, highlighting a critical point: a significant portion of farms, particularly smaller operations, are not profitable solely from farming, even in favorable economic years. This is partly due to the USDA’s broad definition of a farm, which encompasses many smaller, non-commercial entities.
However, off-farm income plays a crucial role in the financial stability of farm households. In 2023, the median off-farm income reached $79,900. When combined with farm income, the median total household income for farm families stood at $97,984. It’s important to note that the median represents the midpoint, where half of households earn less and half earn more. Due to the varied distribution of farm and off-farm income, the median total income is not simply the sum of median off-farm and median farm income.
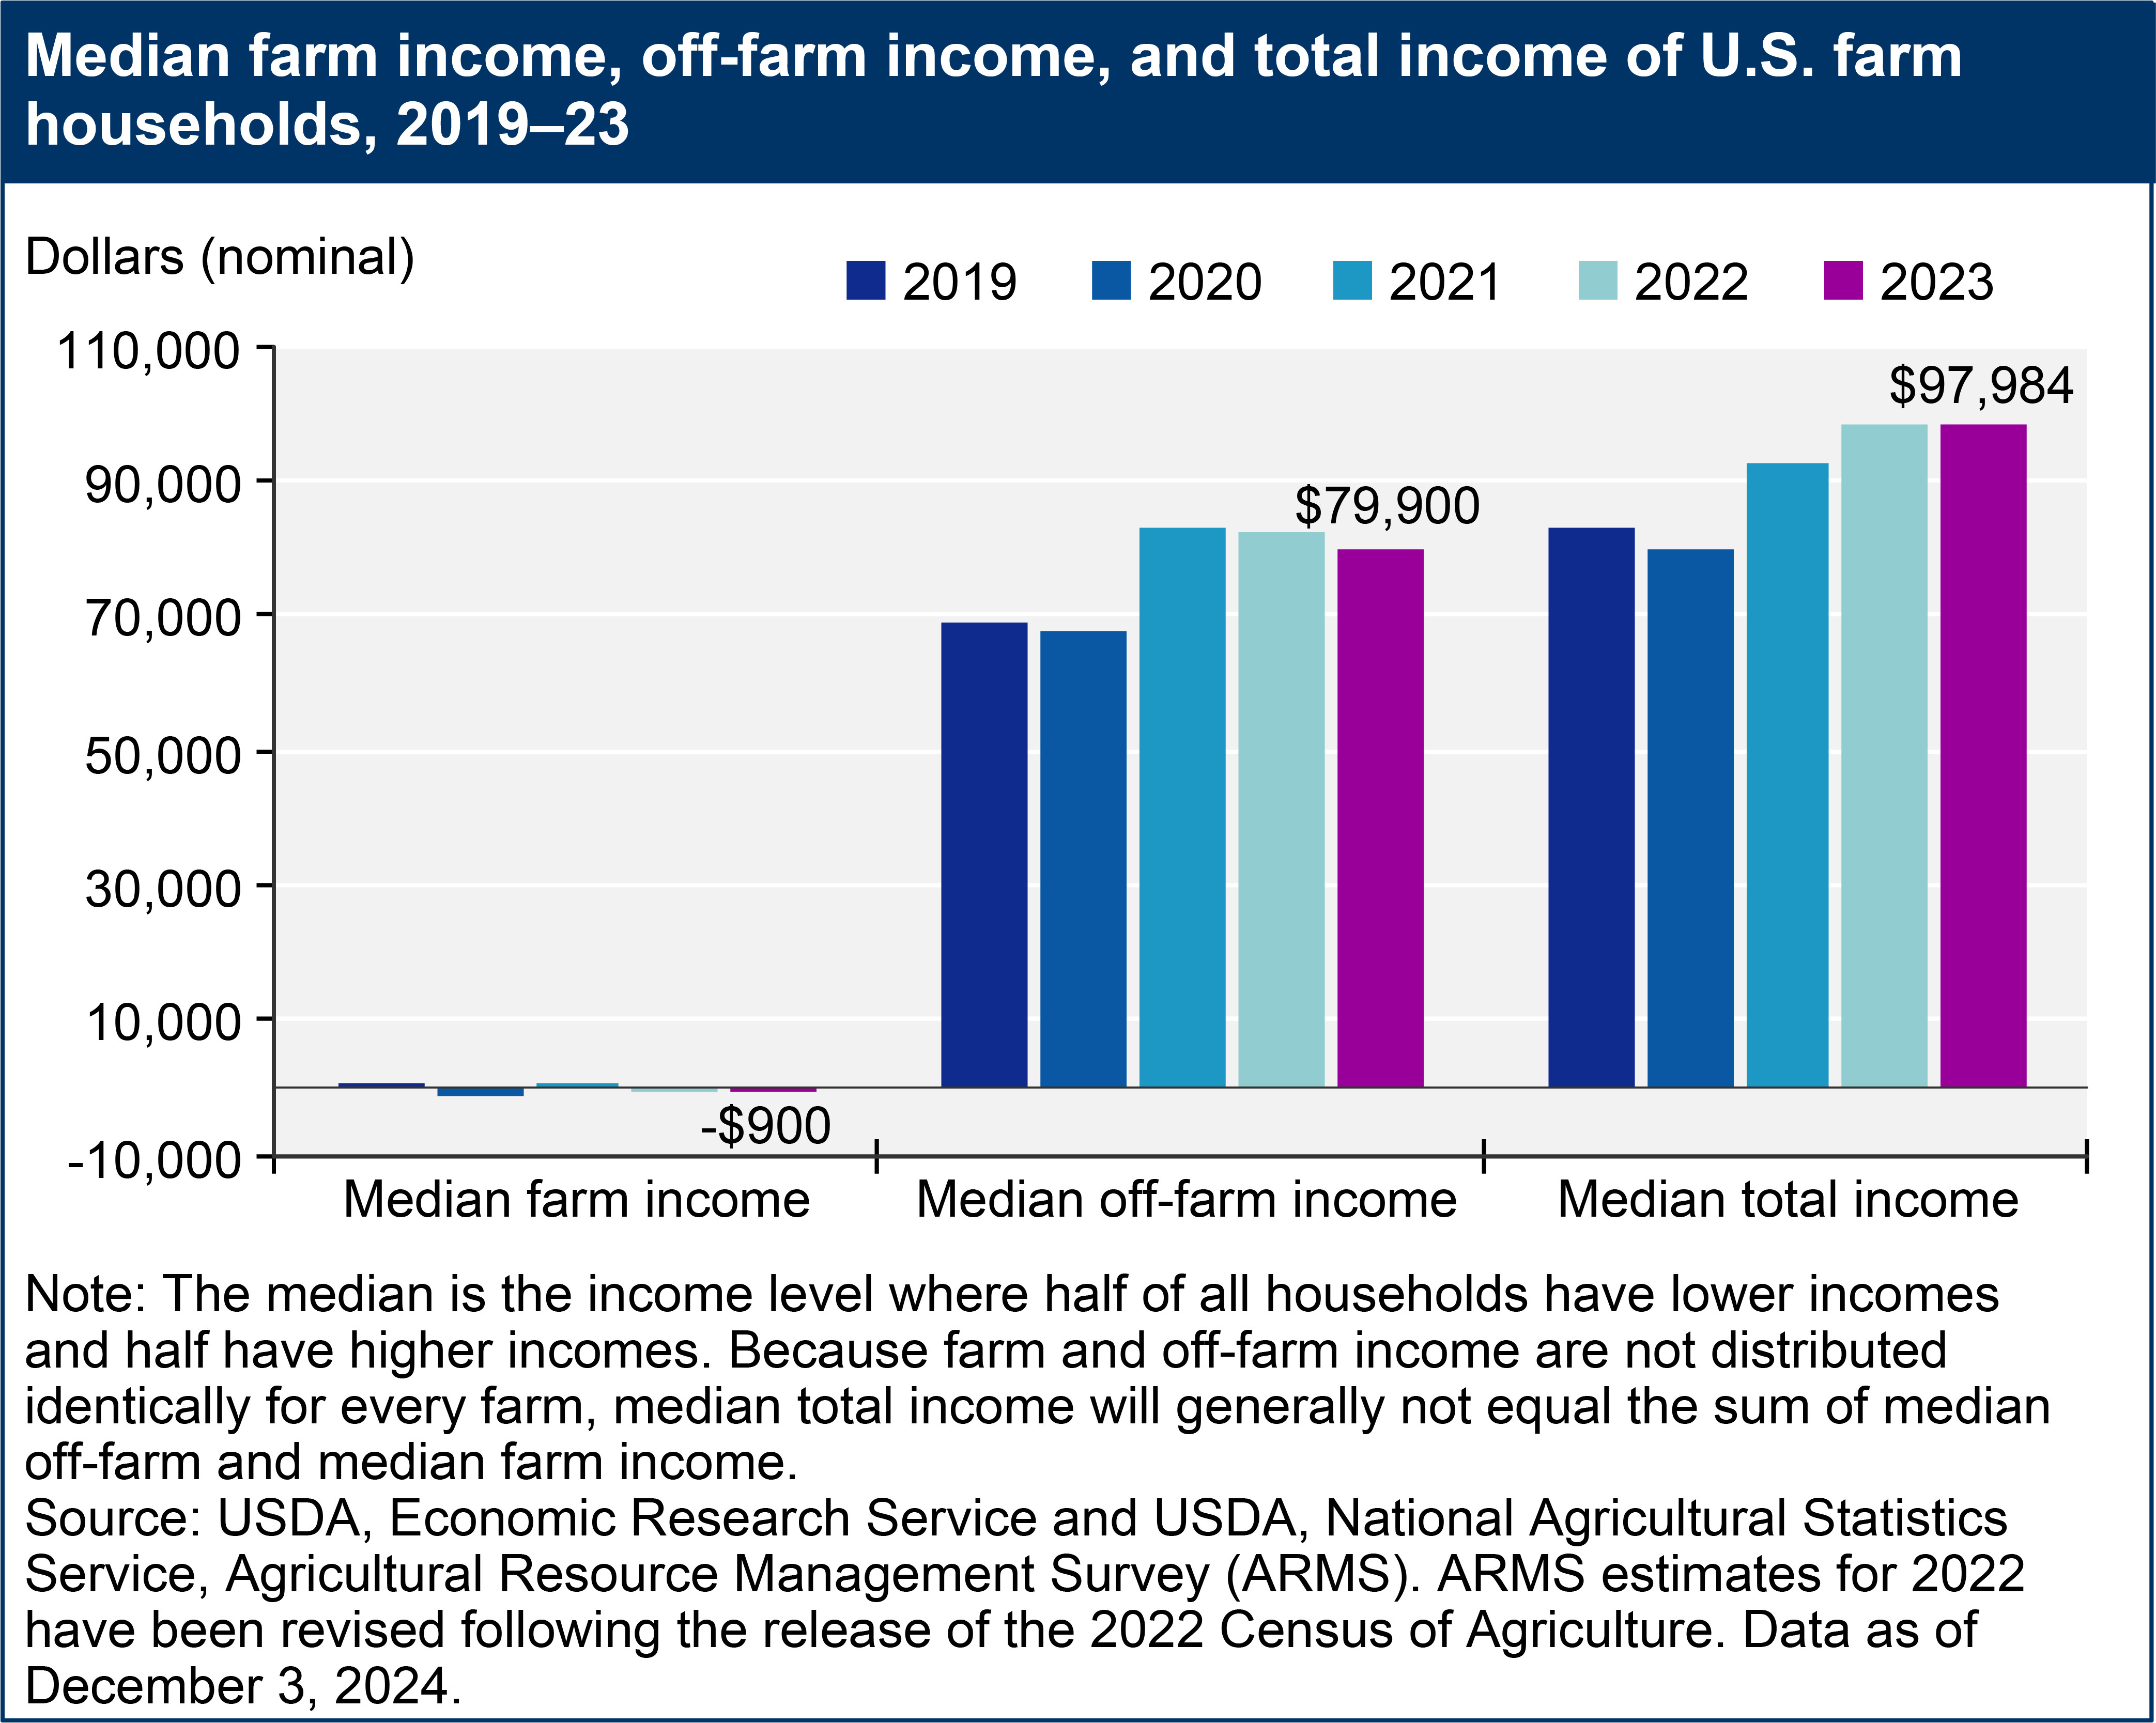 Bar chart illustrating median farm income, off-farm income, and total income of U.S. farm households from 2019 to 2023, showing income trends over five years.
Income Disparities Based on Farm Type
To gain a deeper understanding of farm household income, it’s essential to consider the different types of farms. The USDA, ERS categorizes farms using a typology that combines annual gross cash farm income with the principal operator’s occupation. This classification helps create more homogenous groups for analysis.
Within this typology, family farms with an annual gross cash farm income below $350,000 are considered small farms. These are further divided into residence farms and intermediate farms. Residence farms are those where the principal operator considers themselves retired or has a primary occupation outside of farming. Intermediate farms are those where the operator identifies farming as their primary occupation but is not retired from farming. Commercial farms, on the other hand, are defined as farms with a gross cash farm income of $350,000 or more, irrespective of the operator’s primary occupation. A key distinction is that commercial farm households typically derive the majority of their income from farming, unlike residence and intermediate farms.
The landscape of U.S. family farms is evolving, with a gradual decline in the number of farms over the last decade. The approximately 1.8 million family farms operating across the nation exhibit significant diversity in size, income sources, and overall financial status.
In 2023, commercial family farms demonstrated a significantly higher median income from farming, reaching $167,550, and a median total household income of $253,496. In contrast, intermediate farms faced a median farm income deficit of -$1,974, leading to a lower median total household income of $62,014. Residence farms, despite also experiencing a median farm income deficit of -$1,980, benefited from substantial off-farm income, resulting in a higher median total income ($116,493) compared to intermediate farms in 2023.
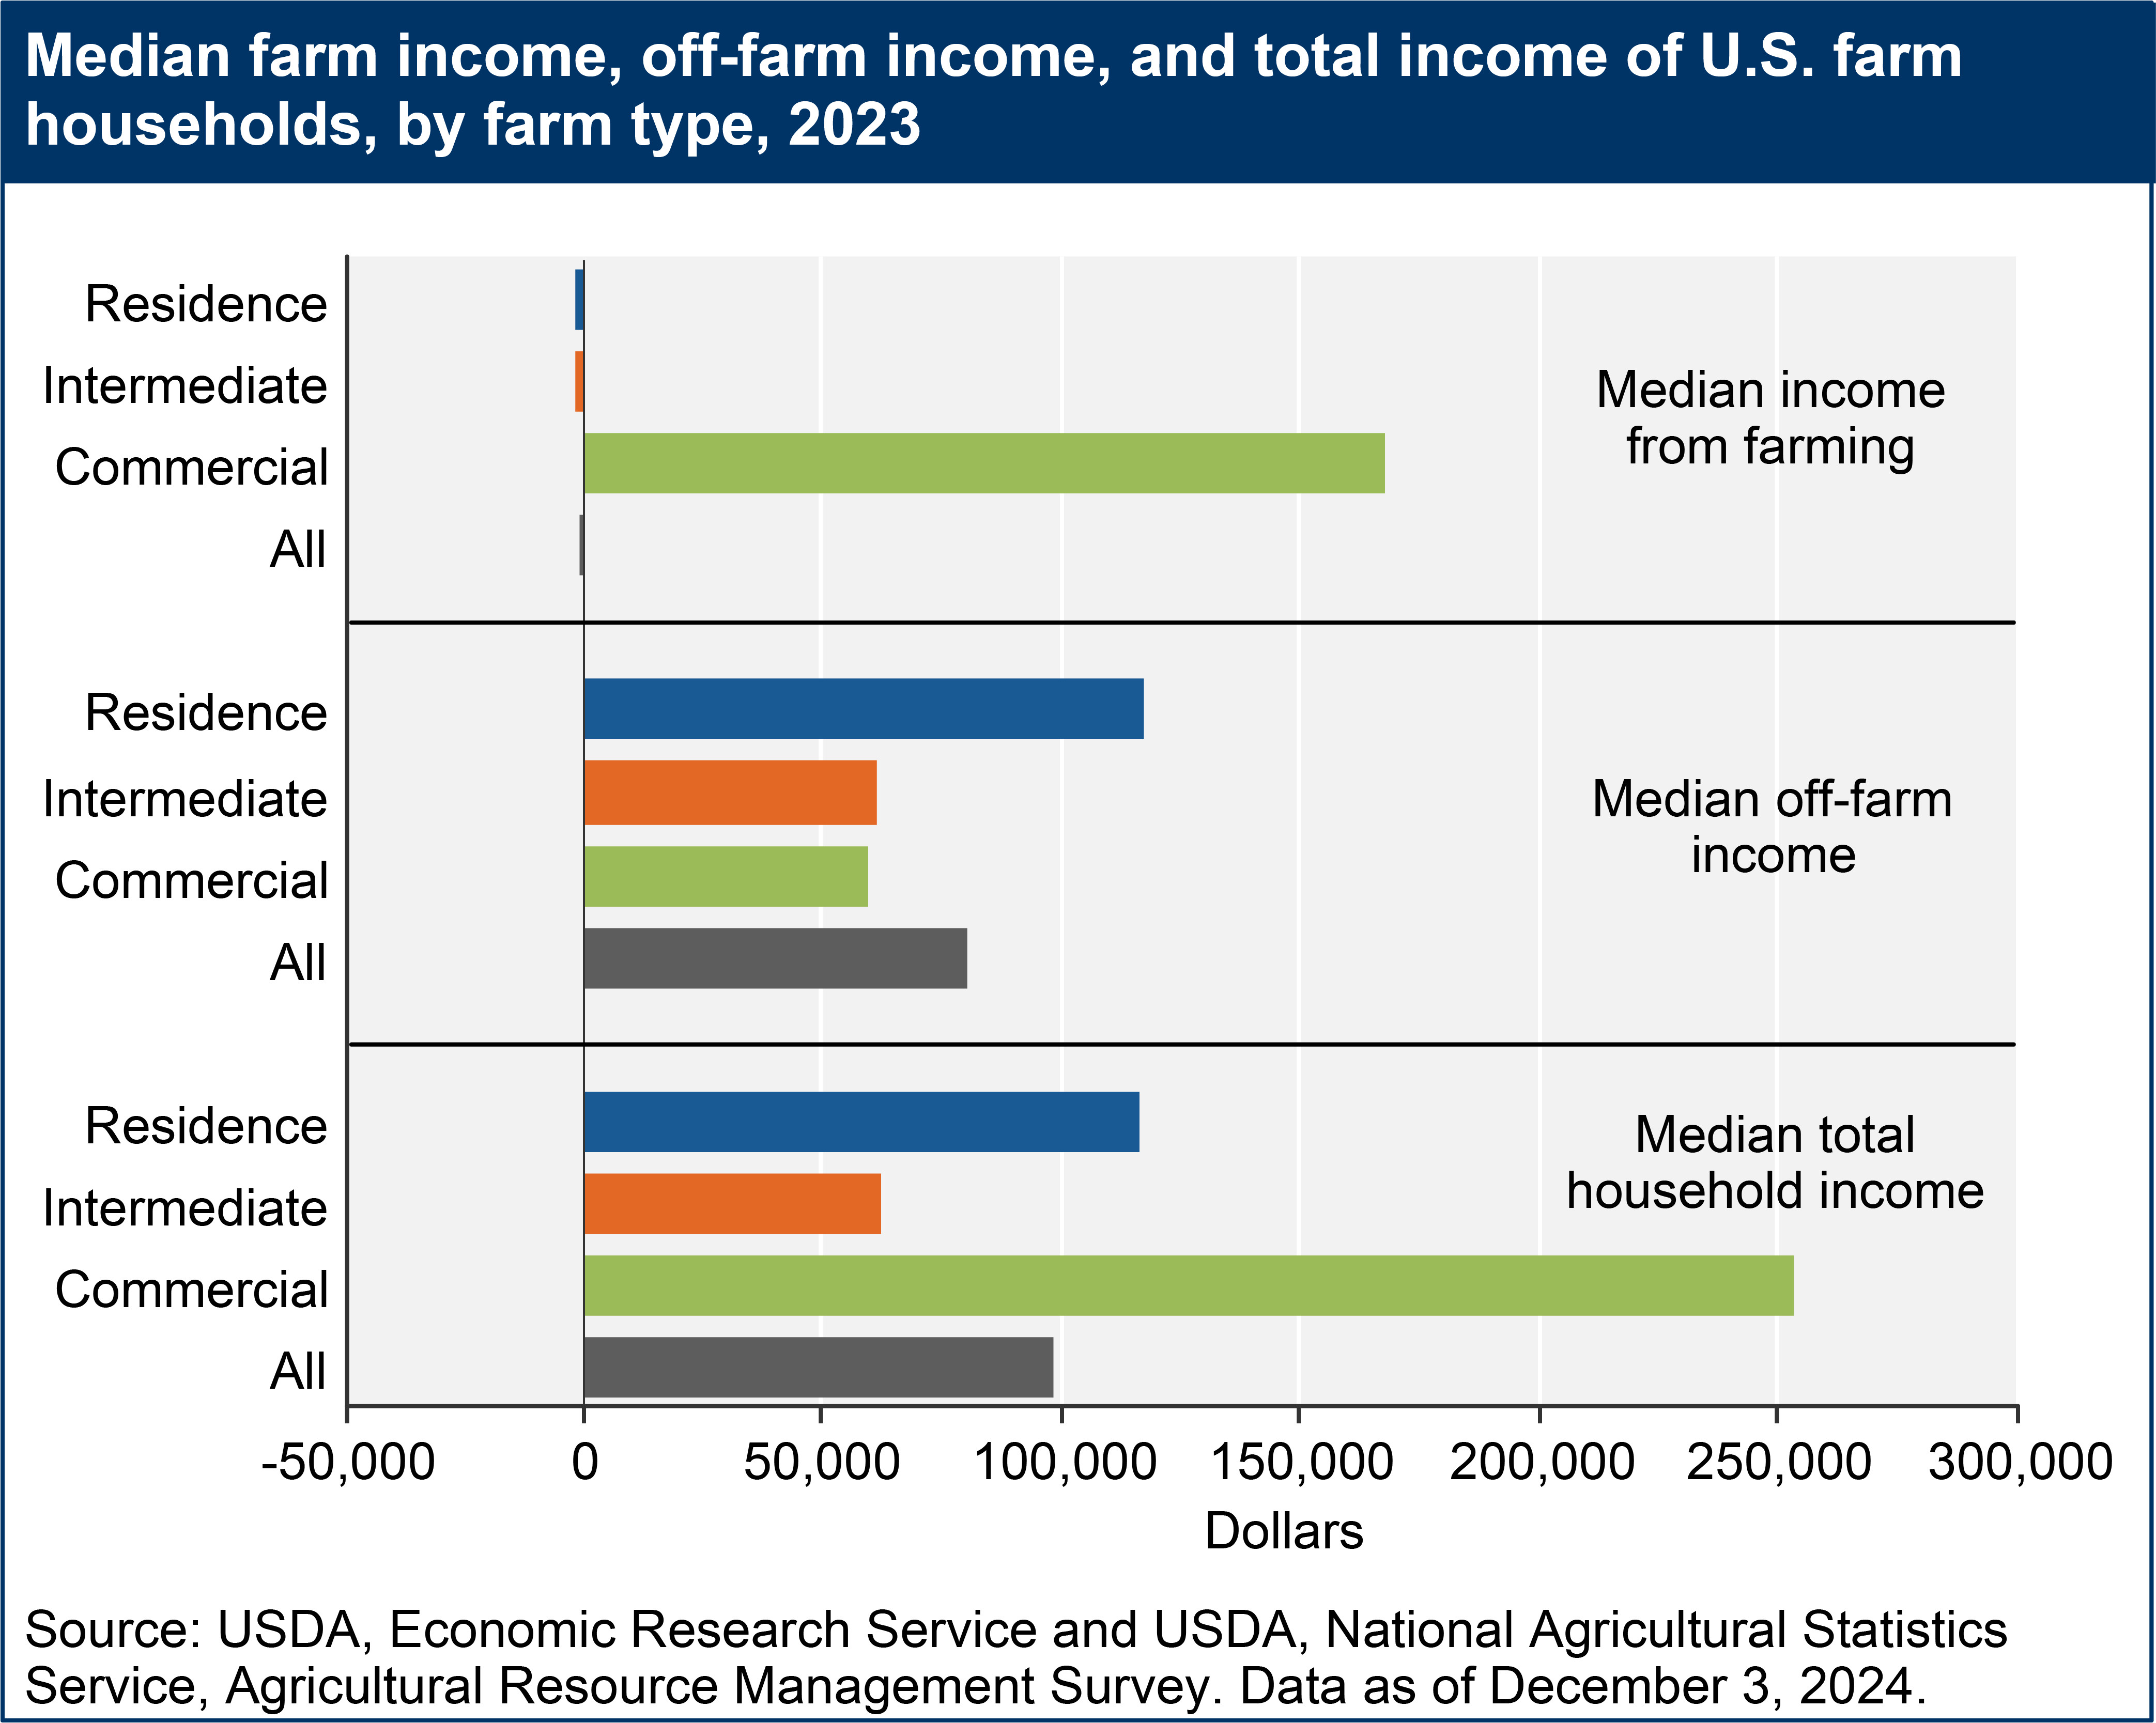 Bar chart comparing median farm income, off-farm income, and total income of U.S. farm households by farm type in 2023, highlighting income differences across farm categories.
The reliance on farm income as a proportion of total household income further clarifies the financial dynamics of these farm types. For residence farms, farm income often constitutes a small fraction of their total annual income. Intermediate farms rely on farm income as a secondary, but more significant, income source. Conversely, commercial farms typically depend on farm income as their primary financial engine. In 2023, only 39 percent of residence farms reported positive income from farming, and for those, it contributed a mere 6 percent to their total household income at the median. Among intermediate farms, 46 percent had positive farm income, representing 27 percent of their total household income at the median. For commercial farms, a significant 84 percent reported positive farm income, contributing a substantial 80 percent to their total household income at the median.
 Bar chart showing the percentage of U.S. farm households with positive farm income and the median share of total household income from farming in 2023, illustrating farm income reliance.
The Influence of Commodity Specialization on Farm Income
Farm income is also significantly influenced by commodity specialization. A farm’s specialization is determined by the commodity or group of commodities that constitutes at least 50 percent of its total agricultural production value. Market and production conditions vary across different commodities each year, leading to income variations based on specialization. Furthermore, factors such as the scale of operation and the extent of off-farm work undertaken by the operator and household members also contribute to income differences. For instance, managing a dairy farm, with its demanding and continuous nature, often limits the operator’s ability to engage in substantial off-farm employment.
 Bar chart comparing median farm income and median total income of U.S. farm households by commodity specialization in 2023, showcasing income variations based on farm focus.
Regional Variations in Farm Household Income
Geographic location plays a crucial role in shaping farm household incomes. These regional differences largely reflect variations in farm typology and commodity specialization across different areas. The USDA, ERS has categorized farms into nine resource regions based on soil, climate, and agronomic factors that often transcend state boundaries.
In recent years, the Northern Great Plains and Heartland Farm Resource Regions have consistently shown positive median farm incomes for farm households, with $10,597 and $5,367 respectively in 2023. Farm households in these regions also tend to have the highest total household incomes. The Heartland region, characterized by its extensive cropland and dominance in cash grain and cattle farms, boasts the largest number of farms and commercial farms and the highest value of production. The Northern Great Plains region is a leading producer of wheat and barley.
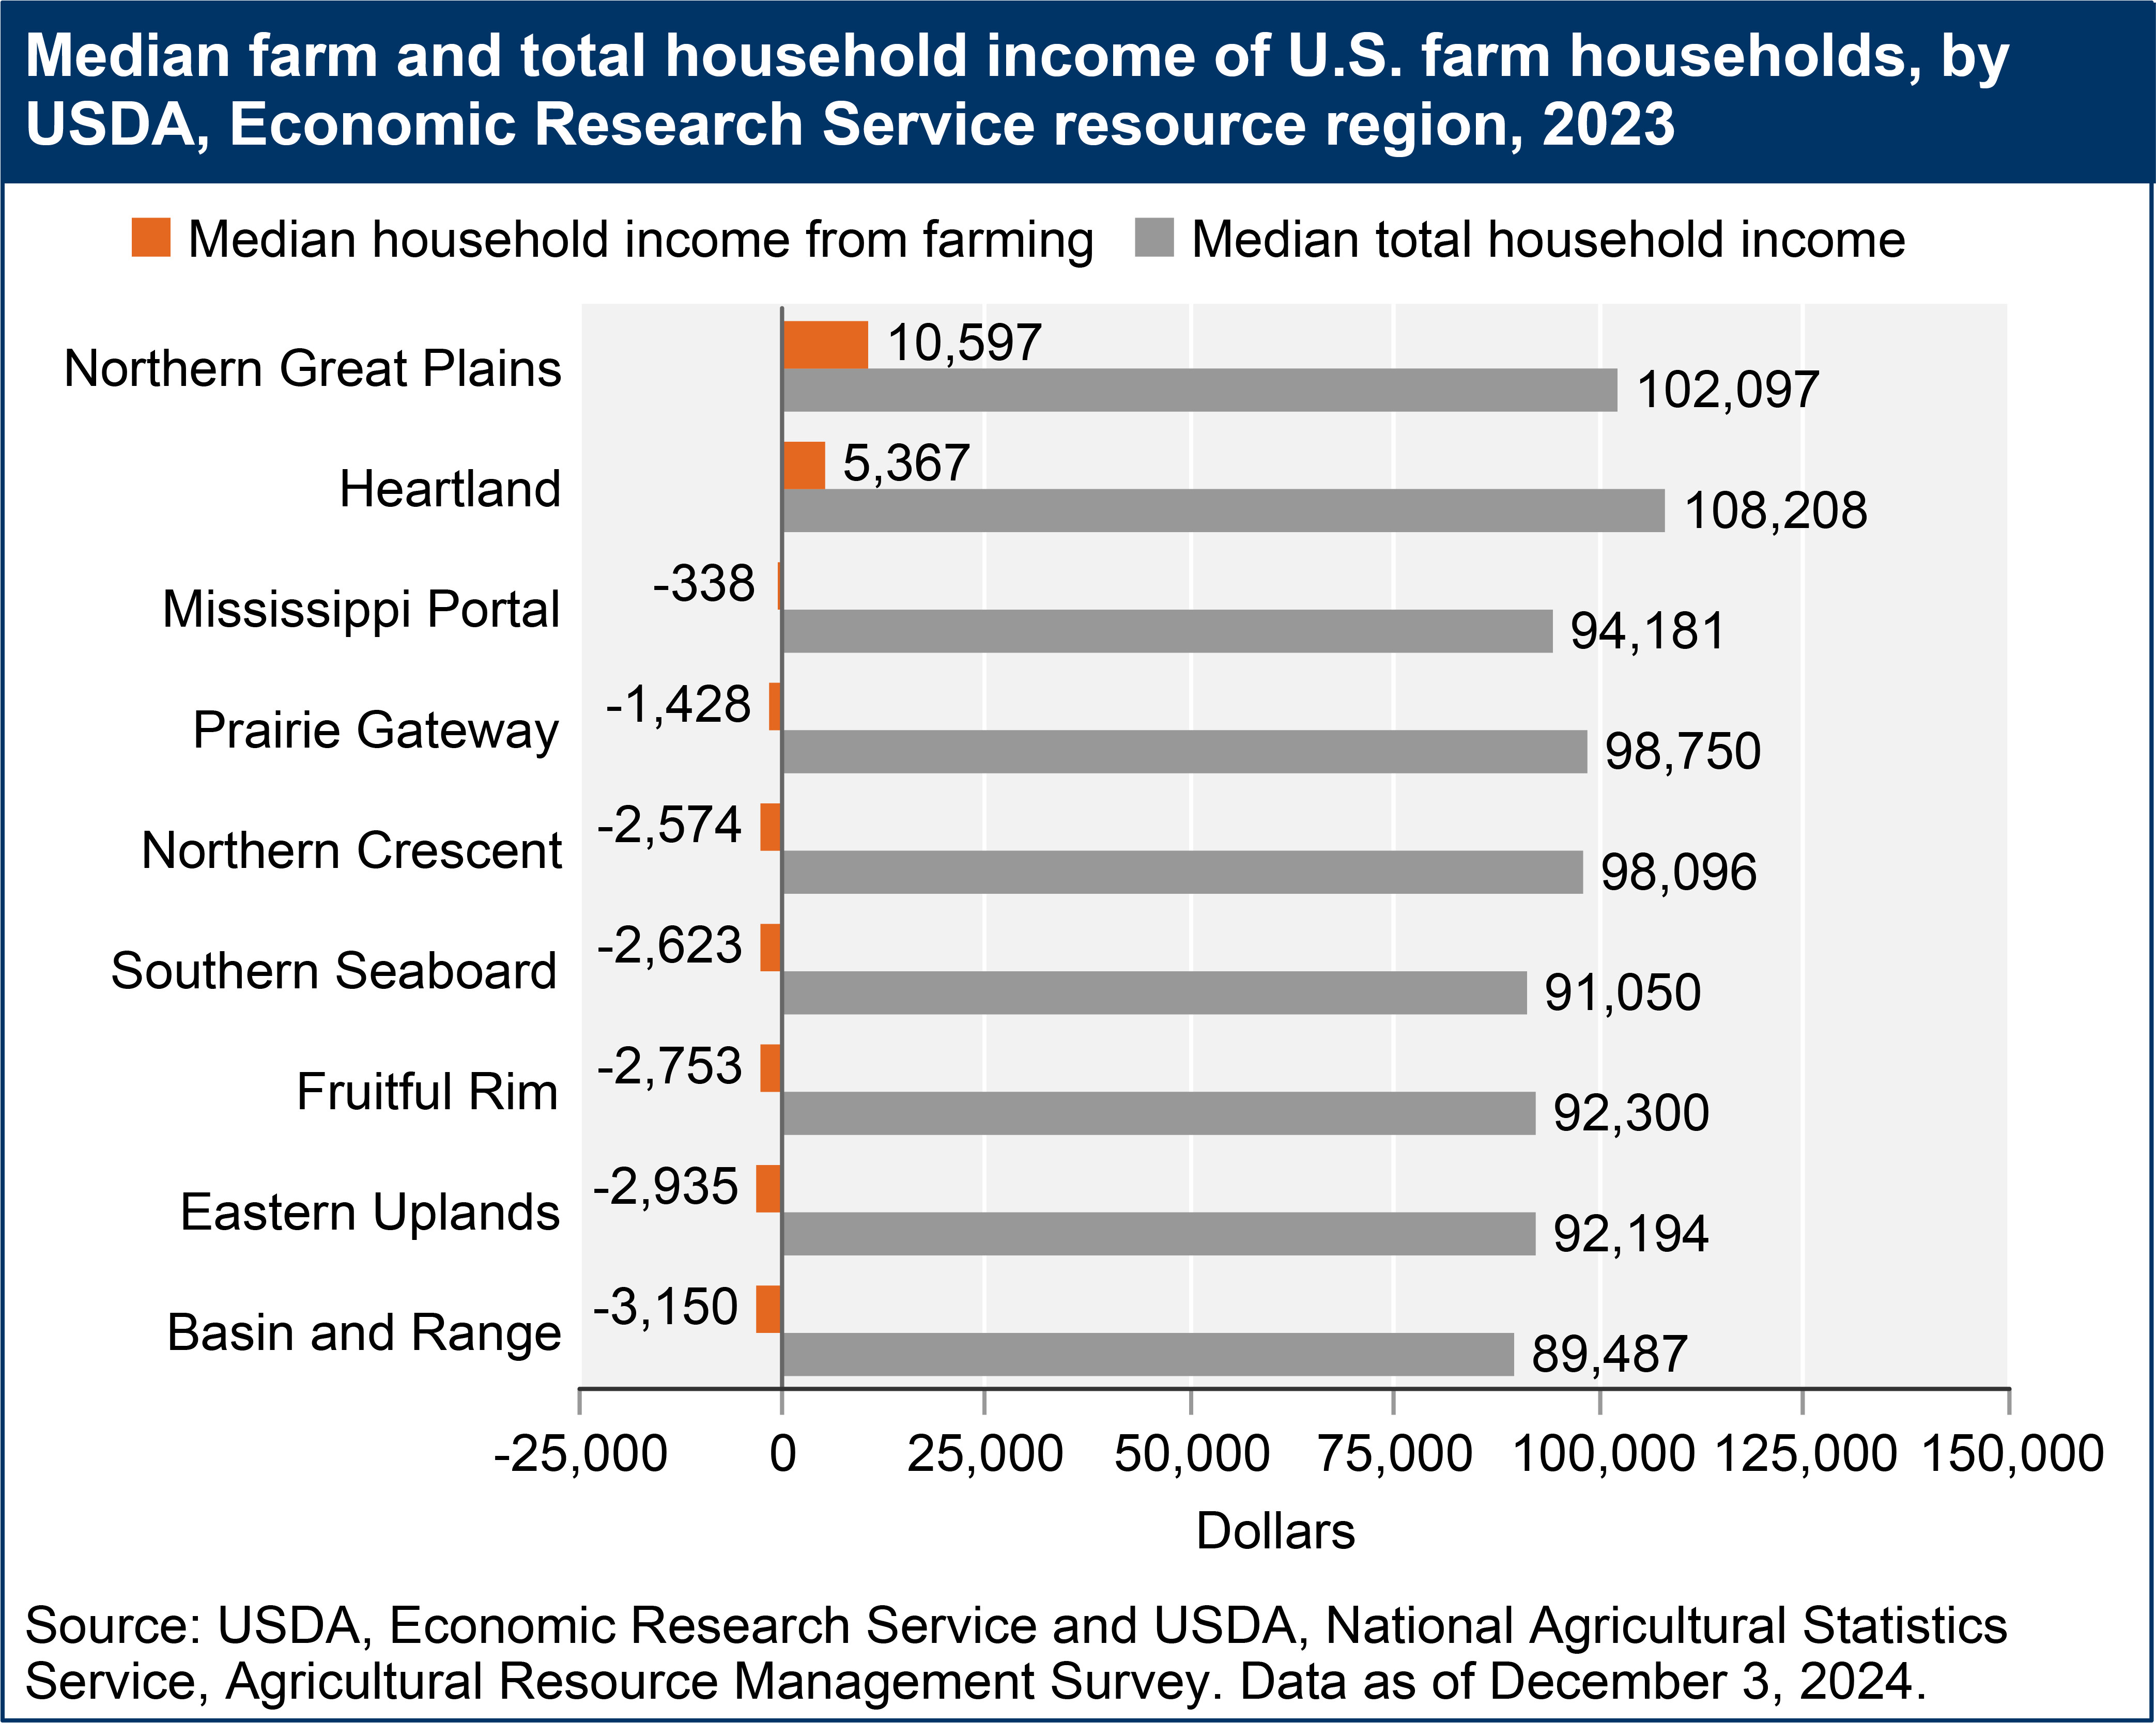 Bar chart displaying median farm and total household income of U.S. farm households by USDA Economic Research Service resource region in 2023, highlighting regional income disparities.
Conclusion
Understanding the average American family income requires a nuanced perspective, especially when considering farm households. The data from USDA ERS reveals a complex financial picture for U.S. farm families in 2023. While median total farm household income remains considerable due to significant off-farm income contributions, income from farming itself is often negative for a substantial portion of farms. Income levels are significantly differentiated by farm type, commodity specialization, and geographic location. For many farm families, particularly those operating residence and intermediate farms, off-farm income is not just supplemental but essential for maintaining financial stability and achieving an income comparable to the average American family. This underscores the diverse economic realities within the agricultural sector and the importance of considering these factors when evaluating the financial well-being of American families as a whole.