
Creating a family tree visualization can be a fascinating way to explore ancestry or represent hierarchical data. While Tableau isn’t inherently designed for family trees, its flexibility allows for innovative solutions. This guide will walk you through the process of building an interactive family tree in Tableau, inspired by node-link diagrams, making it accessible even if you’re relatively new to the platform. Whether you’re visualizing your own lineage or exploring complex relationships in data, this tutorial will provide a solid foundation.
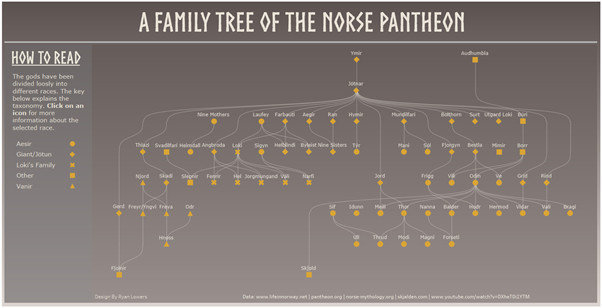 Norse Gods Family Tree in Tableau
Understanding the Foundation: Node-Link Tree Diagrams
Before diving into Tableau, it’s essential to understand the concept behind this visualization. We’re essentially creating a node-link tree diagram. These diagrams are perfect for showing hierarchical relationships, with nodes representing individuals or entities and links showing the connections between them. A key resource for this approach is Jeffrey Shaffer’s blog post on node tree link diagrams in Tableau, which provides the groundwork for the technique we’ll be using. The beauty of this method lies in its curved lines and hierarchical structure, making it aesthetically pleasing and functionally suitable for representing family trees or similar structures.
The core concept revolves around levels and two calculated fields, T and T2, which dictate how the connecting lines are drawn. Understanding these fields is crucial for successful implementation:
- Levels: Each tier in the hierarchy is assigned a level, starting with the root node (the ancestor or starting point).
- T: This field is a numerical sequence ranging from -6 to 6, incrementing by 0.25. It’s fundamental for the curve calculation.
- T2: For the root node, T2 is the same as T. For each subsequent level, 12 is added to T. So, Level 1: T2 = T + 12, Level 2: T2 = T + 24, and so on. This incremental addition ensures the hierarchical spacing between levels in the visualization.
With this understanding, we can now focus on structuring our data to effectively build our family tree visualization.
Preparing Your Family Tree Data
The data structure is critical for creating this type of visualization in Tableau. Think of each row in your dataset as representing a connection between two individuals in your family tree. For each connection, we need to define specific fields to position the nodes and create the links. Here are the essential fields:
- Category: This field acts as a unique identifier for each connection, essentially labeling the relationship between two nodes (e.g., “Parent-Child,” “Spouse”).
- Tier: This indicates the hierarchical level of the first node in the connection. The root ancestor would be Tier 0, their children Tier 1, and so on.
- Start Point (X-coordinate): The horizontal position of the first node in the connection. You’ll need to assign X-coordinates to position individuals across the tree.
- End Point (X-coordinate): The horizontal position of the second node in the connection.
- Label 1 Name/Race/Description: Information about the first individual in the connection (e.g., Name, Race, a brief Description).
- Label 2 Name/Race/Description: Information about the second individual.
- Child Num: A numerical identifier for children stemming from the same parent node. This is crucial for preventing node duplication later on.
This structured data input, while requiring manual preparation, is relatively straightforward to populate. You essentially define each relationship (connection), the starting node’s level (tier), their horizontal positions (start and end points), and descriptive labels.
A key consideration is handling individuals who have descendants across multiple tiers. To avoid duplicate nodes for the same person, you might need to introduce placeholder values in certain connections. This ensures that individuals are represented by a single node even if they connect to multiple generations.
Data Preparation Workflow: Alteryx and Excel
To streamline data preparation, especially for larger family trees, you can leverage tools like Alteryx or Excel.
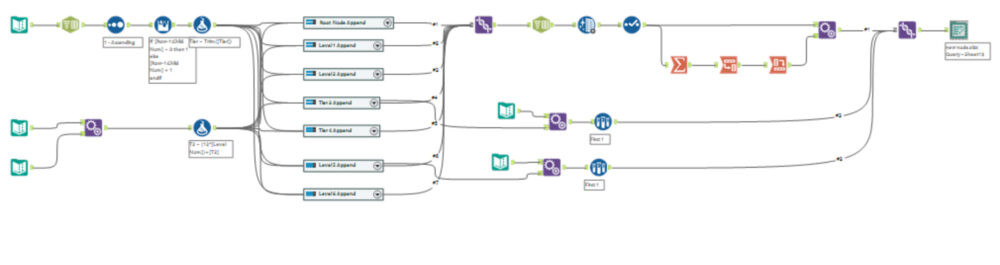 Alteryx Workflow for Family Tree Data Preparation
Alteryx Workflow
An Alteryx workflow can automate the data transformation process efficiently. The workflow typically involves these steps:
- Input Data: Start with three input sources:
- Connections List: Your raw data outlining family relationships (as described in “Preparing Your Family Tree Data”).
- Tier List: A simple table defining each tier level.
- T and T2 Root Values: A table containing the base T and T2 values for the root tier.
- Calculate T2: Use an “Append Fields” tool to duplicate the T and T2 values for each tier. Then, with a “Formula” tool, calculate T2 for each level using the formula:
T2 = (12 * Level) + T. - Isolate Tier Data: Employ “Filter” tools to separate data for each tier, repeating this for both connections and T values.
- Combine Tier Data: For each tier, use “Append Fields” to duplicate connection records for every T and T2 value relevant to that tier.
- Union Data: After processing each tier, use a “Union” tool to combine all tier outputs back into a single dataset.
- Clean and Transform: Split the “Category” field to separate node names, cleanse whitespace, and remove unnecessary columns.
- Label Aggregation: Aggregate labels for the first node of each connection into a single cell. This can be useful for labeling in Tableau.
- Handle Isolated Nodes: Create separate inputs for individuals without ancestors or descendants. Assign placeholder labels and use “Append Fields” and “Sample” tools to ensure they are correctly included in the dataset.
Excel Data Preparation
If you don’t have Alteryx, Excel can also be used to prepare your data, although it involves more manual steps:
- Connections Template: Utilize the provided Excel template (“connections template sheet”) to input your family tree connections. Remember to populate the “Child Num” column, numbering children for each parent.
- Duplicate for T and T2: Duplicate each connection record for every value of T and T2 corresponding to the relevant tier. Store these in a “combined data” sheet.
- Split and Concatenate Labels: Use Excel’s “Text to Columns” feature to split the “Category” column into labels for the first and second nodes. Employ the
CONCATfunction to combine labels for the first node into a single cell (e.g., “Pos 1 Label Check”).
Building the Family Tree Visualization in Tableau
Once your data is prepared, it’s time to bring it into Tableau and create the visualization. Jeffrey Shaffer’s Tableau template is an excellent starting point as it includes pre-built examples and necessary calculations.
- Connect to Data: Open the template in Tableau and connect to your prepared family tree data source.
- Recreate Calculations: Replicate the essential calculations from the template within your newly connected dataset. These calculations are the engine of the visualization.
Key Tableau Calculations
-
Curve Calculation: This calculation is responsible for drawing the curved lines connecting the nodes. It uses the sigmoid function to achieve the curved appearance by plotting numerous tiny marks between nodes.
-
Points Calculation: This calculation determines the placement of each node (individual) on the chart. You may need to adapt the default version to accommodate specific labeling needs and taxonomic information related to your data.
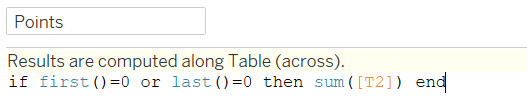 Tableau Points Calculation
Constructing the Chart
-
Initial Setup: Drag “SUM(Curve)” to the Columns shelf and “SUM(T2)” and “Points” to the Rows shelf.
-
Detail and Dimension: In the Marks card (“All” section), drag “Category” to “Detail” and “T” to “Detail”. Convert “T” to a “Dimension” by clicking the dropdown and selecting “Dimension.”
-
Dual Axis: Right-click one of the measures on the Rows shelf (either “SUM(T2)” or “Points”) and select “Dual Axis” to overlay the two charts.
-
Reverse Axis: If your chart appears upside down, double-click each axis. In the axis menu, check the “Reversed” option to orient the chart correctly.
-
Mark Types: In the Marks card (“All” section), ensure “Measure Names” is not on “Color.” Change the mark type for “SUM(T2)” to “Line” and for “Points” to “Shape.”
-
Table Calculation for Points: Right-click the “Points” measure on the Rows shelf, select “Edit Table Calculation,” choose “Specific Dimensions,” and check the box for “T.” This ensures the correct number of nodes are drawn.
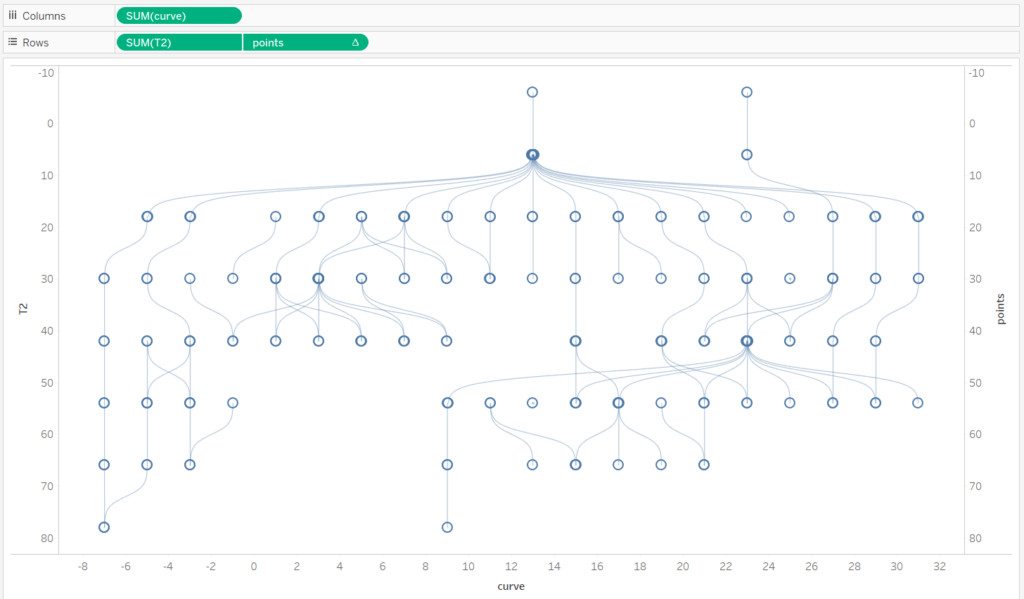 Initial Family Tree Chart in Tableau
Deduplicating and Labeling Nodes
At this stage, you might notice overlapping nodes, particularly for individuals with multiple connections. To address this and enable accurate labeling, we need to create two more calculated fields:
-
Deduplicated Points Calculation: This calculation refines the “Points” field to eliminate duplicate nodes. It uses conditional logic (IF/ELSE statements) and fields like “Child Num” to determine when a node should be rendered, effectively removing overlaps.
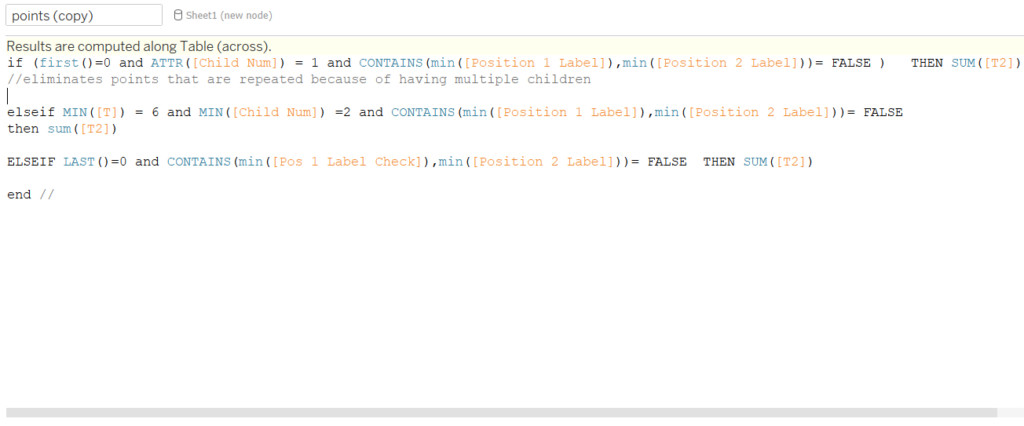 Tableau Deduplicated Points Calculation
Replace the original “Points” field on the Rows shelf with this new “Deduplicated Points” field and ensure the table calculation (“Specific Dimensions,” “T” checked) is correctly applied.
-
Node Label Calculation: This simpler table calculation is used to correctly label each node with the individual’s name or relevant identifier.
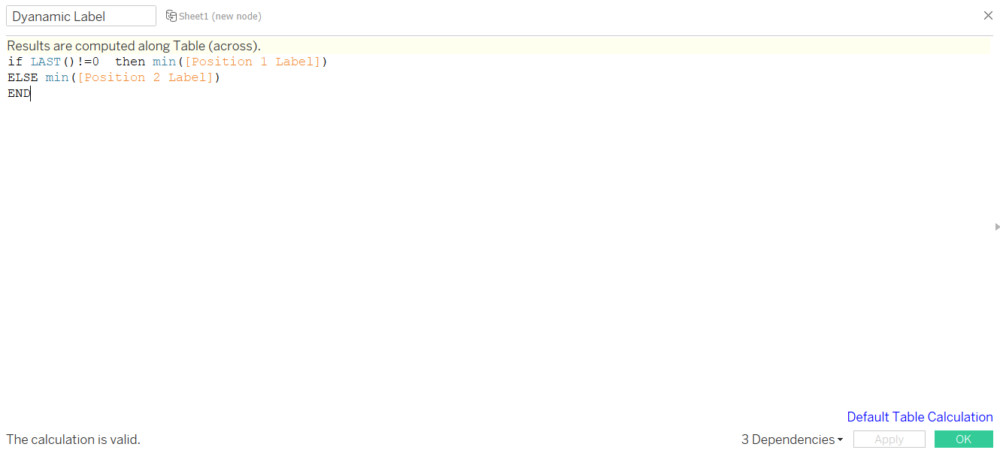 Tableau Node Label Calculation
Drag this “Node Label” field to the “Label” shelf within the “Points” mark type in the Marks card.
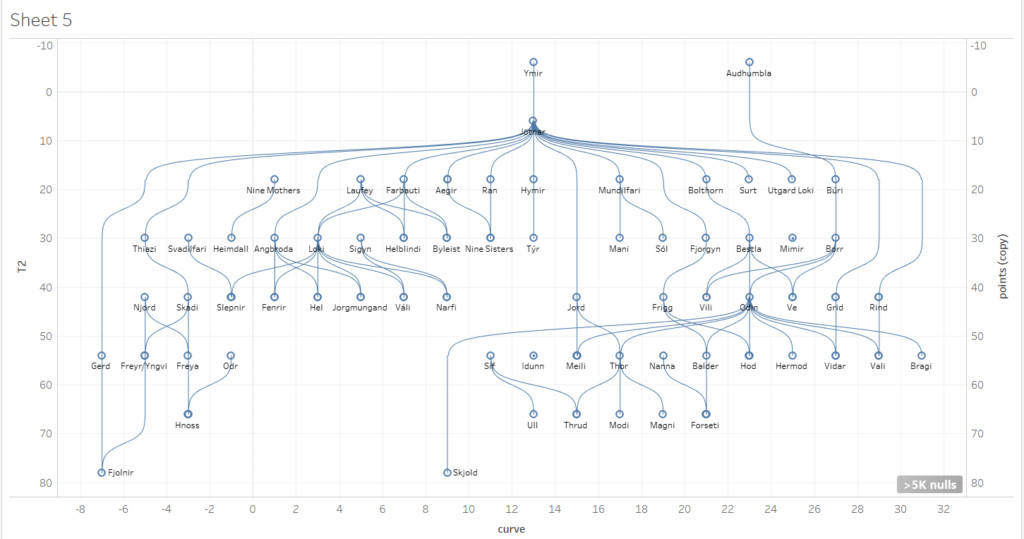 Adding Node Labels to Family Tree
Finalizing Your Interactive Family Tree
By following these steps, you should have successfully built an interactive family tree visualization in Tableau. This method, leveraging node-link diagram principles, provides a visually appealing and informative way to represent genealogical or hierarchical data.
Remember to explore customization options in Tableau to enhance your family tree further. You can adjust colors, shapes, fonts, and add interactive filters to allow users to explore the data dynamically. Consider adding tooltips to display additional information when users hover over nodes, enriching the user experience.
For further exploration, you can download the provided Alteryx workflow or the Tableau Public version of the visualization as starting points. Experiment with different datasets and chart configurations to master the art of building family trees and similar visualizations in Tableau.
Data template in Excel
Zipped Alteryx Workflow